How often does bitcoin fall 5% in a day? 7 times in 365 days
Days when bitcoin swings 5% between its high and its low are far more common than days when it closes 5% down. Both counts here come from 365 closed daily bitcoin candles in Binance's public market data.
- Where the data comes from and when a trading day starts
- 365 days grouped by how far bitcoin closed up or down
- The year's biggest drop and biggest gain came on February 5 and 6
- 5% intraday swings are over three times as common as 5% closes
- What these numbers are good for if you're just starting out
- Bitcoin's daily moves: questions people ask
Over the 365 days from September 23, 2025 to September 22, 2026, bitcoin closed down 5% or more on 7 of them, about once every 52 days on average. The count comes from BTCUSDT daily candles on Binance's public market data API, and every candle used had already closed.
So a 5% drop in a day is nowhere near an everyday event, and it's also far from a once-in-several-years one. It turns up several times a year.
Where the data comes from and when a trading day starts
The data is the BTCUSDT 1-day candle series, bitcoin priced in USDT, from Binance's public market data API (data-api.binance.vision). It was pulled on September 23, 2026 and runs from 2025-09-22 to 2026-09-22 (UTC), 366 candles in all. The first candle is used only for its closing price, as the previous day for September 23, 2025; the 365 days after it are the ones counted.
The candle for September 23, 2026 hadn't closed when the data was pulled and its closing price was still moving, so it was left out.
Each day's change uses this formula:
Close-to-close change = that day's close ÷ previous day's close − 1
On February 6, 2026, for instance, the close was 70,580.26 and the previous day's close was 62,909.86, so 70,580.26 ÷ 62,909.86 − 1 ≈ +12.19%.
Binance daily candles roll over at 00:00 UTC, which is 8 a.m. Beijing time. February 5 here means the 24 hours from 00:00 UTC on February 5 to 00:00 UTC on February 6. If the app you normally use cuts the day at midnight in another time zone, or shows a rolling 24-hour change, its numbers won't match these, and that's expected. All prices here are in USDT.
365 days grouped by how far bitcoin closed up or down
The overall picture first: of the 365 days, 178 closed up and 187 closed down, close to an even split. Ranked by the absolute size of the change, the median is 1.30%, so on half the days the close moved less than 1.3%. The mean is 1.66%, noticeably above the median, which says a handful of very large days pulled the average up.
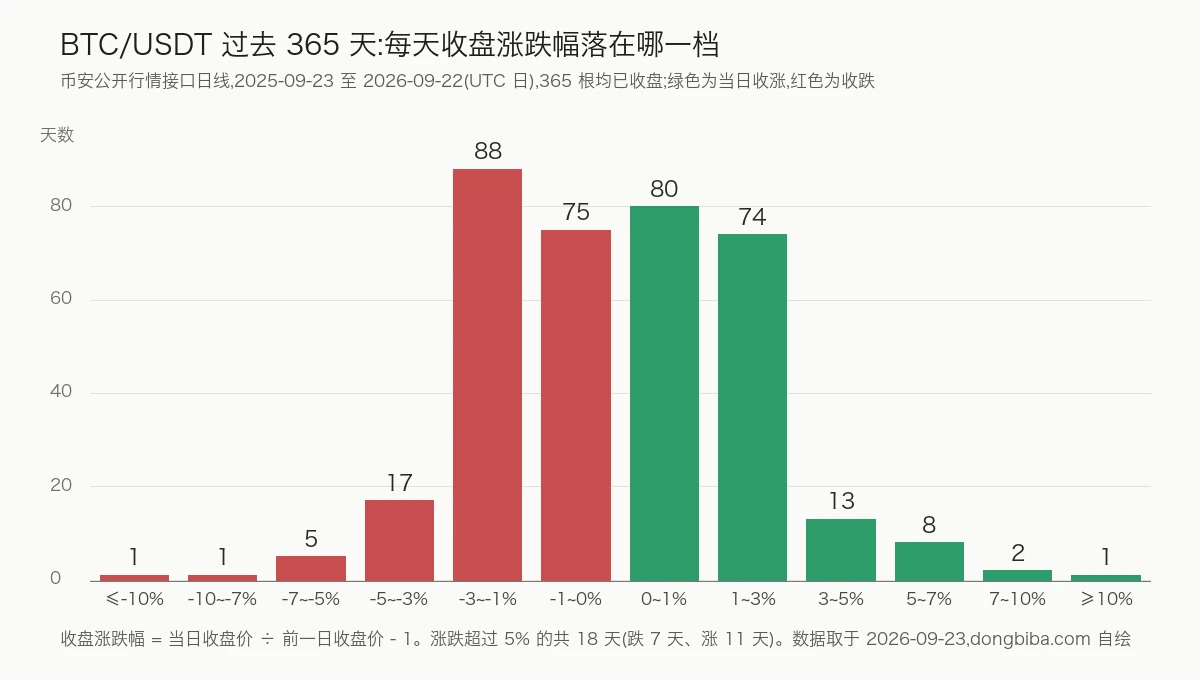
Past the ±3% line the bars drop away sharply. The close moved less than 1% on 155 days and between 1% and 3% on 162 days (88 down, 74 up). Together that's 317 days, about 87% of the year.
The table below is cumulative: each row includes all the larger ones. The 18 days at 5% or more, for example, are also counted in the 48 days at 3% or more.
| Close-to-close change (absolute) | Days | Closed down | Closed up | Share of 365 days |
|---|---|---|---|---|
| 1% or more | 210 | 112 | 98 | 57.5% |
| 2% or more | 104 | 57 | 47 | 28.5% |
| 3% or more | 48 | 24 | 24 | 13.2% |
| 5% or more | 18 | 7 | 11 | 4.9% |
| 7% or more | 5 | 2 | 3 | 1.4% |
| 10% or more | 2 | 1 | 1 | 0.5% |
The counts are easier to remember as one day in every so many (365 ÷ days). The close moved 3% or more on 48 days, one every 7.6 days on average, roughly once a week. It moved 5% or more on 18 days, about one in 20. Drops of 5% or more came on 7 days, about one every 52 days. And moves of 10% or more happened on just 2 days all year, one down and one up.
Among the big moves of 5% or more, 11 days closed up and 7 closed down. The 1% to 3% band runs the other way, with 88 down days and 74 up days, 14 more down than up. Over the whole year the close went from 112,650.99 on September 22, 2025 to 86,208.56 on September 22, 2026, a fall of 23.47%. Big up days outnumbered big down days by 4, and the price still ended the year more than a fifth lower.
The year's biggest drop and biggest gain came on February 5 and 6
Only two of the 365 days moved more than 10%, and they were back to back: bitcoin closed down 14.02% on February 5, 2026 and up 12.19% the next day, February 6. Those are the largest one-day fall and the largest one-day rise of the year.
| Date (UTC) | Open | High | Low | Close | Close-to-close change | Intraday range |
|---|---|---|---|---|---|---|
| 2026-02-05 | 73,165.84 | 73,341.18 | 62,345.00 | 62,909.86 | −14.02% | 15.03% |
| 2026-02-06 | 62,909.87 | 71,751.33 | 60,000.00 | 70,580.26 | +12.19% | 18.68% |
The range column uses the formula in the next section: for February 5 it's (73,341.18 − 62,345.00) ÷ 73,165.84 ≈ 15.03%, and the 18.68% on February 6 is the largest of the 365 days.
February 5 closed at 62,909.86, only 564.86 above the day's low of 62,345.00, so it finished almost at the bottom. On February 6 the low reached 60,000.00, 2,345 below the previous day's low, and the day still closed up 12.19%. A daily candle gives only four prices (open, high, low and close) and can't show whether the high or the low came first. For the order of events you need candles on a shorter timeframe.
Put the two days together: the February 6 close of 70,580.26 was about 3.53% below the February 5 open of 73,165.84. Someone who checked the price only at those two moments would think it had fallen around 3.5% in two days. In the 48 hours between them the high was 73,341.18 and the low 60,000.00, a spread of more than thirteen thousand.
5% intraday swings are over three times as common as 5% closes
Everything so far uses closing prices. But the price moves up and down within a day, and that's the part people watching the market actually see. The measure for it is the intraday range:
Intraday range = (day's high − day's low) ÷ day's open
The two formulas have different denominators: the close-to-close change divides by the previous day's close, the range by that day's open. Look at the February 6 candle: the previous close was 62,909.86 and the open was 62,909.87, so the denominators differ by 0.01. Where the formulas really differ is the numerator. One looks at where the day ended, the other at how wide it travelled.
| Close-to-close change (absolute) | Intraday range | |
|---|---|---|
| Median | 1.30% | 3.05% |
| Days at 5% or more | 18 | 62 |
| Largest day | 14.02% (2026-02-05, closed down) | 18.68% (2026-02-06) |
A median range of 3.05% means that on half the days, the high and the low were more than 3% apart. The range was 5% or more on 62 days, one day in fewer than six on average (365 ÷ 62 ≈ 5.9). At the same 5% line, only 18 days got there on a closing basis: 62 against 18, more than three times as many.
Only 18 days all year had a close-to-close move of 5% or more, so of the 62 days with a range above 5%, at least 44 closed less than 5% away from the previous close. Those 44 days are about 12% of the year.
February 6 is a ready example. It closed up 12.19%, yet its low of 60,000.00 was about 4.6% below the open of 62,909.87. Anyone who looked only at the moment of the low saw a down day. So when a headline says bitcoin fell 5%, first work out whether it means the close, a moment during the day, or the past 24 hours.
What these numbers are good for if you're just starting out
The first use is seeing a 5% drop in a day against the whole year. Going by the table above, it turns up several times a year, so the next time that headline appears there's no need to treat it as unprecedented.
The second is position size. Take $10,000: on a median day (1.30%) the account moves by about $130; a close 5% down is $500; a 14.02% fall like February 5 is $1,402. Swap in the amount you actually plan to put in. If a median day is already enough to cost you sleep, go back and rethink the amount before deciding how much to put in first.
A 14.02% fall followed by a 12.19% rise doesn't bring you back to where you started. $10,000 first becomes $8,598.00 (10,000 × 0.8598), and a 12.19% rise on that makes $9,646.10 (8,598.00 × 1.1219). After the two days you're still down about $354. A percentage down and a percentage up don't cancel out.
The day counts in the table come from September 2025 to September 2026. They can't tell you what tomorrow will do, or when to buy or sell.
Bitcoin's daily moves: questions people ask
What was bitcoin's biggest one-day drop in the 365 days to September 22, 2026?
In the year these statistics cover, September 23, 2025 to September 22, 2026, the deepest one-day fall on a closing basis was 14.02% on February 5, 2026, and it was the only day all year that fell more than 10%. Earlier years weren't included, so this can't give the all-time record.
What does intraday range mean?
Range measures how wide the price travelled within one day: the day's high minus its low, divided by the open. It ignores whether the day closed up or down; if the price ran high and dropped low within the day, the range is large. Over the 365 days counted here, the median range on bitcoin's daily candles was 3.05%.
What time does a bitcoin trading day start and end?
On Binance's daily candles the day rolls over at 00:00 UTC, which is 8 a.m. Beijing time, so one candle covers 00:00 UTC to the next 00:00 UTC. Compare prices from midnight to midnight in another time zone and the result won't match the daily candles.
How much to put in first
With a feel for how far a normal day moves, settle the amount for your first buy.
After your first buy
The number in your account jumps around every day, and the first few days are when impulse moves happen.
Market order vs limit order
When the price is moving fast, what each way of placing an order costs you.